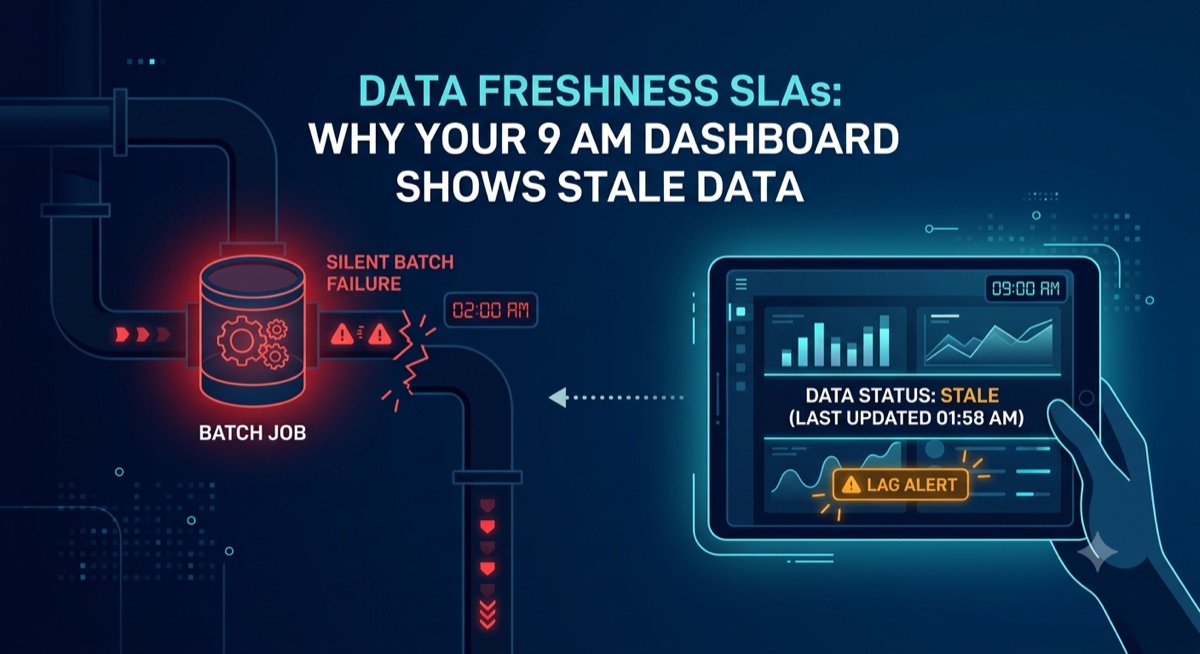
Data Freshness SLAs: Why Your 9 AM Dashboard Shows Stale Data
The 9 AM executive dashboard loads. Revenue shows $1.2M. The actual revenue, including transactions that settled at 3 AM, is $1.8M. The dashboard is showing yesterday’s close, not today’s position. The CFO makes a resourcing decision based on the wrong number.
This is not a data quality problem in the usual sense — the data is correct, it is just late. The pipeline that loads overnight transactions finished at 6 AM, but the dashboard’s source table was snapshotted at midnight. The 6-hour gap between the last event and the dashboard refresh is the freshness delta.
Data freshness SLAs are the least-monitored dimension of data quality. Most teams track accuracy and completeness. Few track the interval between when an event occurs and when it becomes queryable. That interval — pipeline lag — is the metric that determines whether your dashboards are useful or misleading.
Pipeline Lag by Architecture
| Architecture | Typical Lag | Failure Mode |
|---|---|---|
| Batch (daily Airflow) | 6-24 hours | One failed DAG = one stale day |
| Micro-batch (hourly) | 1-4 hours | Partial failure = partial refresh |
| Streaming (Kafka → Flink) | Seconds to minutes | Consumer lag spikes during peak |
Regardless of architecture, the failure pattern is the same: a pipeline component stops producing data, downstream tables stop updating, and no one notices until a user files a ticket.
Defining Freshness SLAs
A freshness SLA has three parameters:
- Source freshness: The maximum acceptable age of the source data (e.g., “source table must reflect events within the last 2 hours”)
- Target freshness: The maximum acceptable age of the derived table (e.g., “the dashboard table must be no more than 30 minutes behind the source”)
- Alert window: How long to wait before escalating (e.g., “page the on-call engineer if lag exceeds the threshold for 15 minutes”)
Express these in a YAML file that serves as the contract between data producers and consumers:
# freshness_slas.yaml
tables:
  - name: fct_revenue
    source: stripe_charges
    source_freshness: 2h
    target_freshness: 30m
    alert_window: 15m
    owner: "payments-team"

  - name: dim_users
    source: postgres_replica
    source_freshness: 1h
    target_freshness: 15m
    alert_window: 10m
    owner: "platform-team"

  - name: agg_daily_active_users
    source: fct_sessions
    source_freshness: 4h
    target_freshness: 1h
    alert_window: 30m
    owner: "analytics-team"
Monitoring Freshness With dbt
dbt has a built-in freshness check for sources. Use it as the first line of defense:
# sources.yml
version: 2

sources:
  - name: stripe
    freshness:
      warn_after: { count: 2, period: hour }
      error_after: { count: 4, period: hour }
    loaded_at_field: created_at
    tables:
      - name: charges
Run dbt source freshness on a schedule (every 15 minutes via cron or a scheduler). Route the output to your alerting system:
#!/bin/bash
# freshness_check.sh — run every 15 minutes
dbt source freshness > /tmp/freshness_output.json

# Parse for failed sources
jq -r '.results[] | select(.status == "fail") | "\(.source_name).\(.table_name): \(.max_loaded_at)"' \
  /tmp/freshness_output.json | \
  while read line; do
    curl -X POST -H "Content-Type: application/json" \
      -d "{\"text\": \"Freshness SLA breached: $line\"}" \
      "$SLACK_WEBHOOK_URL"
  done
This catches source pipeline failures within 15 minutes of occurrence — not when the CFO opens the dashboard.
Pipeline-Level Monitoring With SQL
Freshness checks on source tables tell you the source stopped producing. To catch transformation pipeline failures, compare the MAX(updated_at) of each derived table against the current time:
-- freshness audit query
SELECT
  'fct_revenue' AS table_name,
  MAX(updated_at) AS last_updated,
  EXTRACT(EPOCH FROM (NOW() - MAX(updated_at))) / 3600 AS lag_hours
FROM analytics.fct_revenue

UNION ALL

SELECT
  'dim_users' AS table_name,
  MAX(updated_at) AS last_updated,
  EXTRACT(EPOCH FROM (NOW() - MAX(updated_at))) / 3600 AS lag_hours
FROM analytics.dim_users
Run this every 15 minutes. Route any row where lag_hours > threshold to the on-call rotation.
Streaming Lag Monitoring
For streaming pipelines, freshness monitoring is built into Kafka consumer lag. Every Kafka consumer group exposes the lag between the latest produced offset and the latest consumed offset:
# Kafka consumer lag per topic
kafka-consumer-groups --bootstrap-server localhost:9092 \
  --group revenue_consumer \
  --describe

# Output:
# TOPIC           PARTITION  CURRENT-OFFSET  LOG-END-OFFSET  LAG
# stripe_charges  0          1420000         1420050         50
# stripe_charges  1          980000          980020          20
Export this to a monitoring system (Prometheus + Grafana). Alert if total lag exceeds a threshold. For high-volume pipelines, alert on lag growth rate, not absolute lag — high traffic naturally produces higher lag.
# Prometheus alert: rapid consumer lag growth
rate(kafka_consumer_lag[5m]) > 100
The SLA Dashboard
Build a single dashboard that shows every critical table, its last update time, and whether it meets its SLA:
-- freshness_sla_report.sql
WITH freshness AS (
  SELECT
    'fct_revenue' AS table_name,
    MAX(updated_at) AS last_updated,
    EXTRACT(EPOCH FROM (NOW() - MAX(updated_at))) / 3600 AS lag_hours
  FROM analytics.fct_revenue
  UNION ALL
  SELECT
    'dim_users',
    MAX(updated_at),
    EXTRACT(EPOCH FROM (NOW() - MAX(updated_at))) / 3600
  FROM analytics.dim_users
)
SELECT
  table_name,
  last_updated,
  ROUND(lag_hours, 2) AS lag_hours,
  CASE
    WHEN lag_hours <= 1 THEN '✅ ON TIME'
    WHEN lag_hours <= 4 THEN '⚠️ AT RISK'
    ELSE '🔴 BREACHED'
  END AS sla_status
FROM freshness
ORDER BY lag_hours DESC
Display this on a wall-mounted monitor in the data engineering aisle. The team should see red before the business does.
Trade-offs
Freshness monitoring requires a reliable updated_at column. If your source tables do not have one, you need to infer freshness from file modification times, partition metadata, or event log timestamps. This adds complexity and reduces accuracy.
Frequent freshness checks generate load on source tables. MAX(timestamp) queries on unindexed columns scan entire tables. Add an index on the updated_at column or use partition metadata where available.
Alert fatigue is the biggest risk. If you alert on every 5-minute lag spike, the team will ignore the alerts. Set the alert window to match the recovery time. A 15-minute alert window means the team has 15 minutes to fix the issue before being paged. Adjust up or down based on team size and rotation frequency.
| Data Tier | Freshness SLA | Alert Window | Monitoring Frequency |
|---|---|---|---|
| Executive dashboards | 30 minutes | 5 minutes | Every 5 minutes |
| Operational reports | 4 hours | 30 minutes | Every 15 minutes |
| Batch analytics | 24 hours | 2 hours | Every hour |
| Exploratory data | Best effort | No alert | Daily |
Data freshness is not a technical problem — it is a contract between the pipeline team and the business. Define the SLA in writing, measure it in real time, and escalate when it breaks. The 9 AM dashboard should show 9 AM data.